With Meta-chart, you can save charts online to your dashboard or you can download an image of your chart.
By downloading the image, you can keep a hard copy of your chart and you can then embed that image into any program that supports images– PowerPoint, MicroSoft Word or Google Slides etc.
Part I) Saving and Downloading an Image
Step 1) Create a chart by entering data
Step 2) Click on the “display tab”
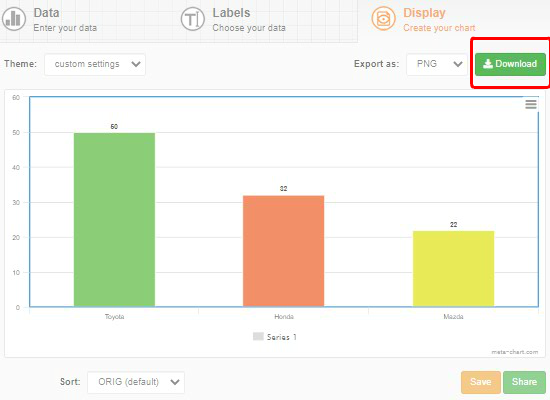
Step 3) Click on the “download button” as shown in diagram 1 below.

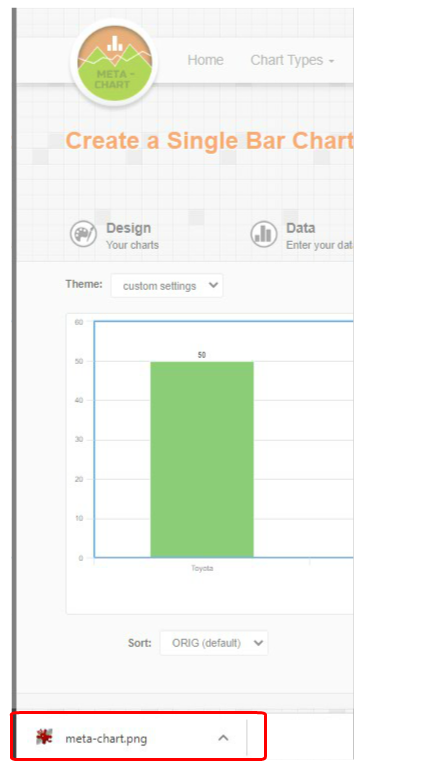
Step 4) Now, that button forces your browser to download an image of the chart to your computer. If you’re using Google Chrome, you’ll see that image at bottom corner of the browser, as shown in Diagram 2 below. If you’re not using Chrome, then you’ll have to figure out where the browser saves images to.

Part II) Embedding the image in an application
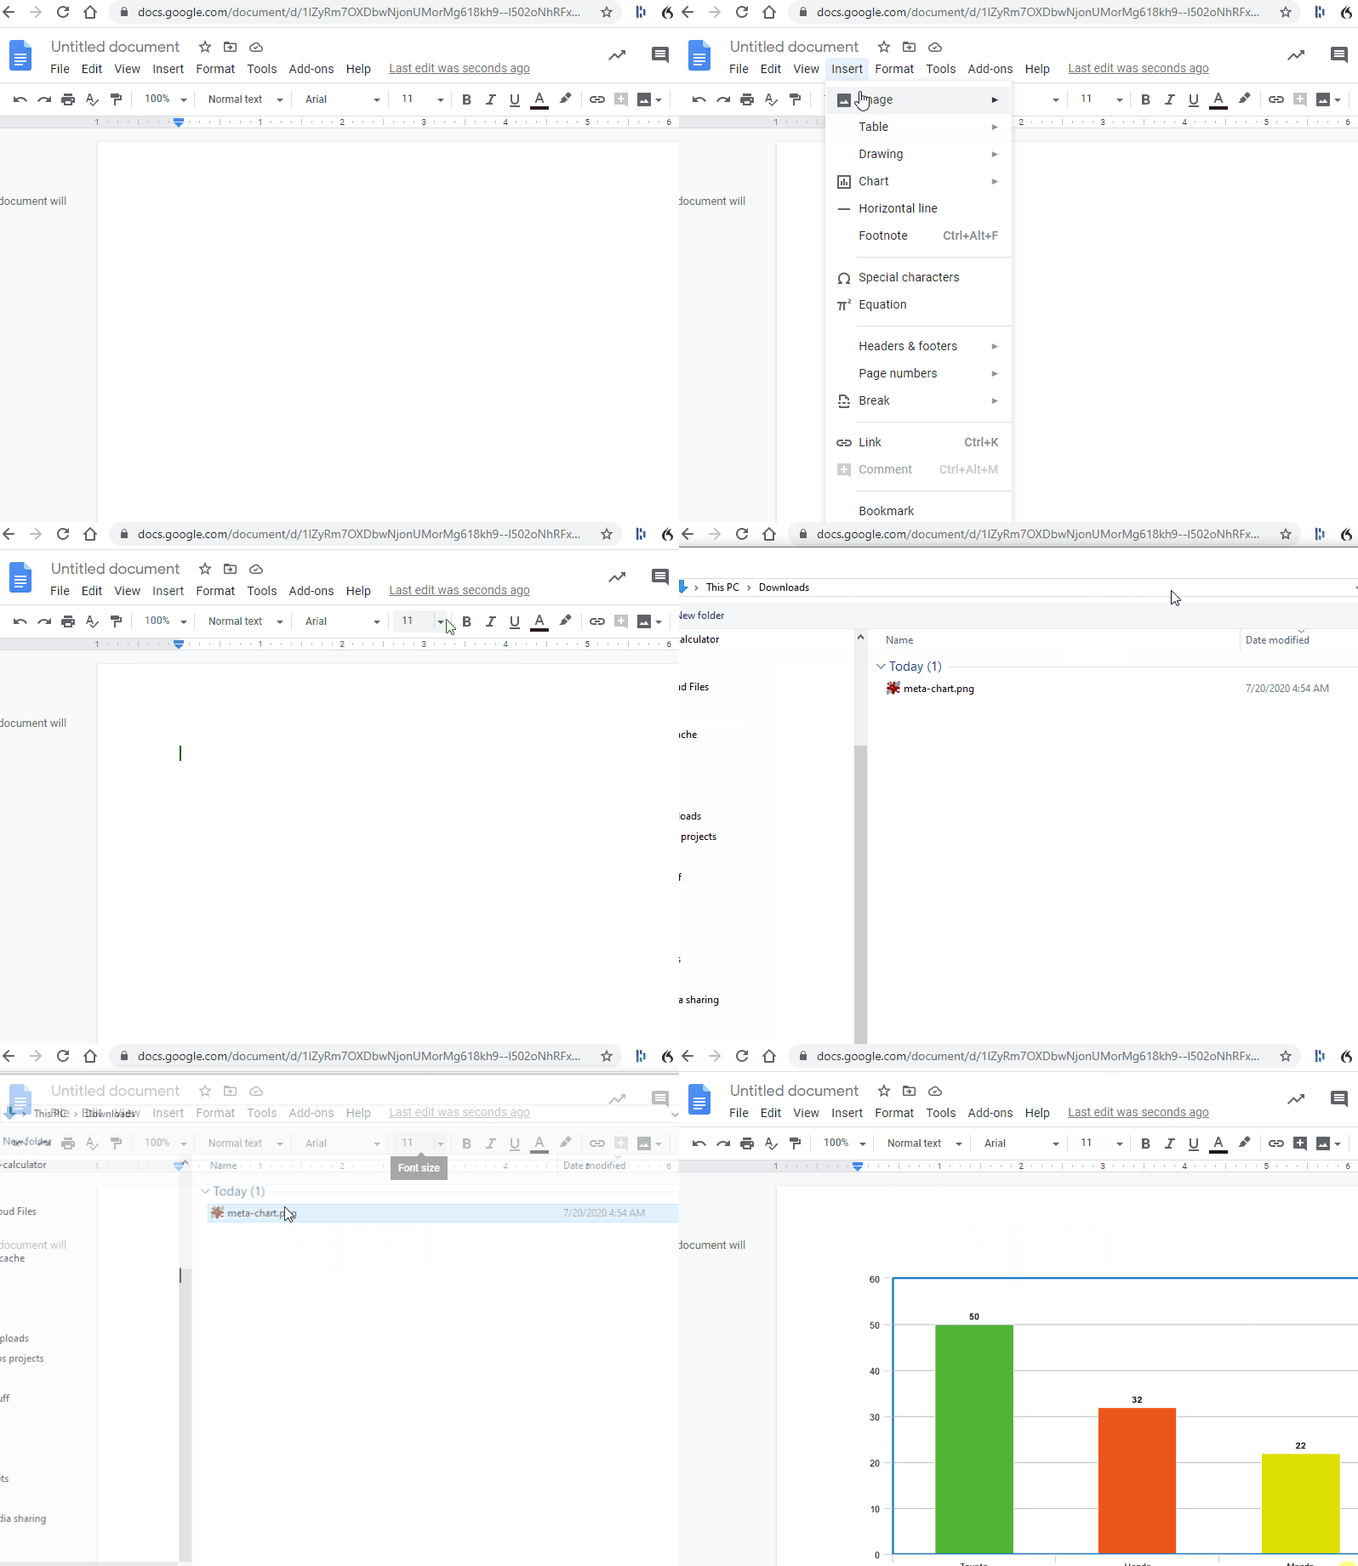
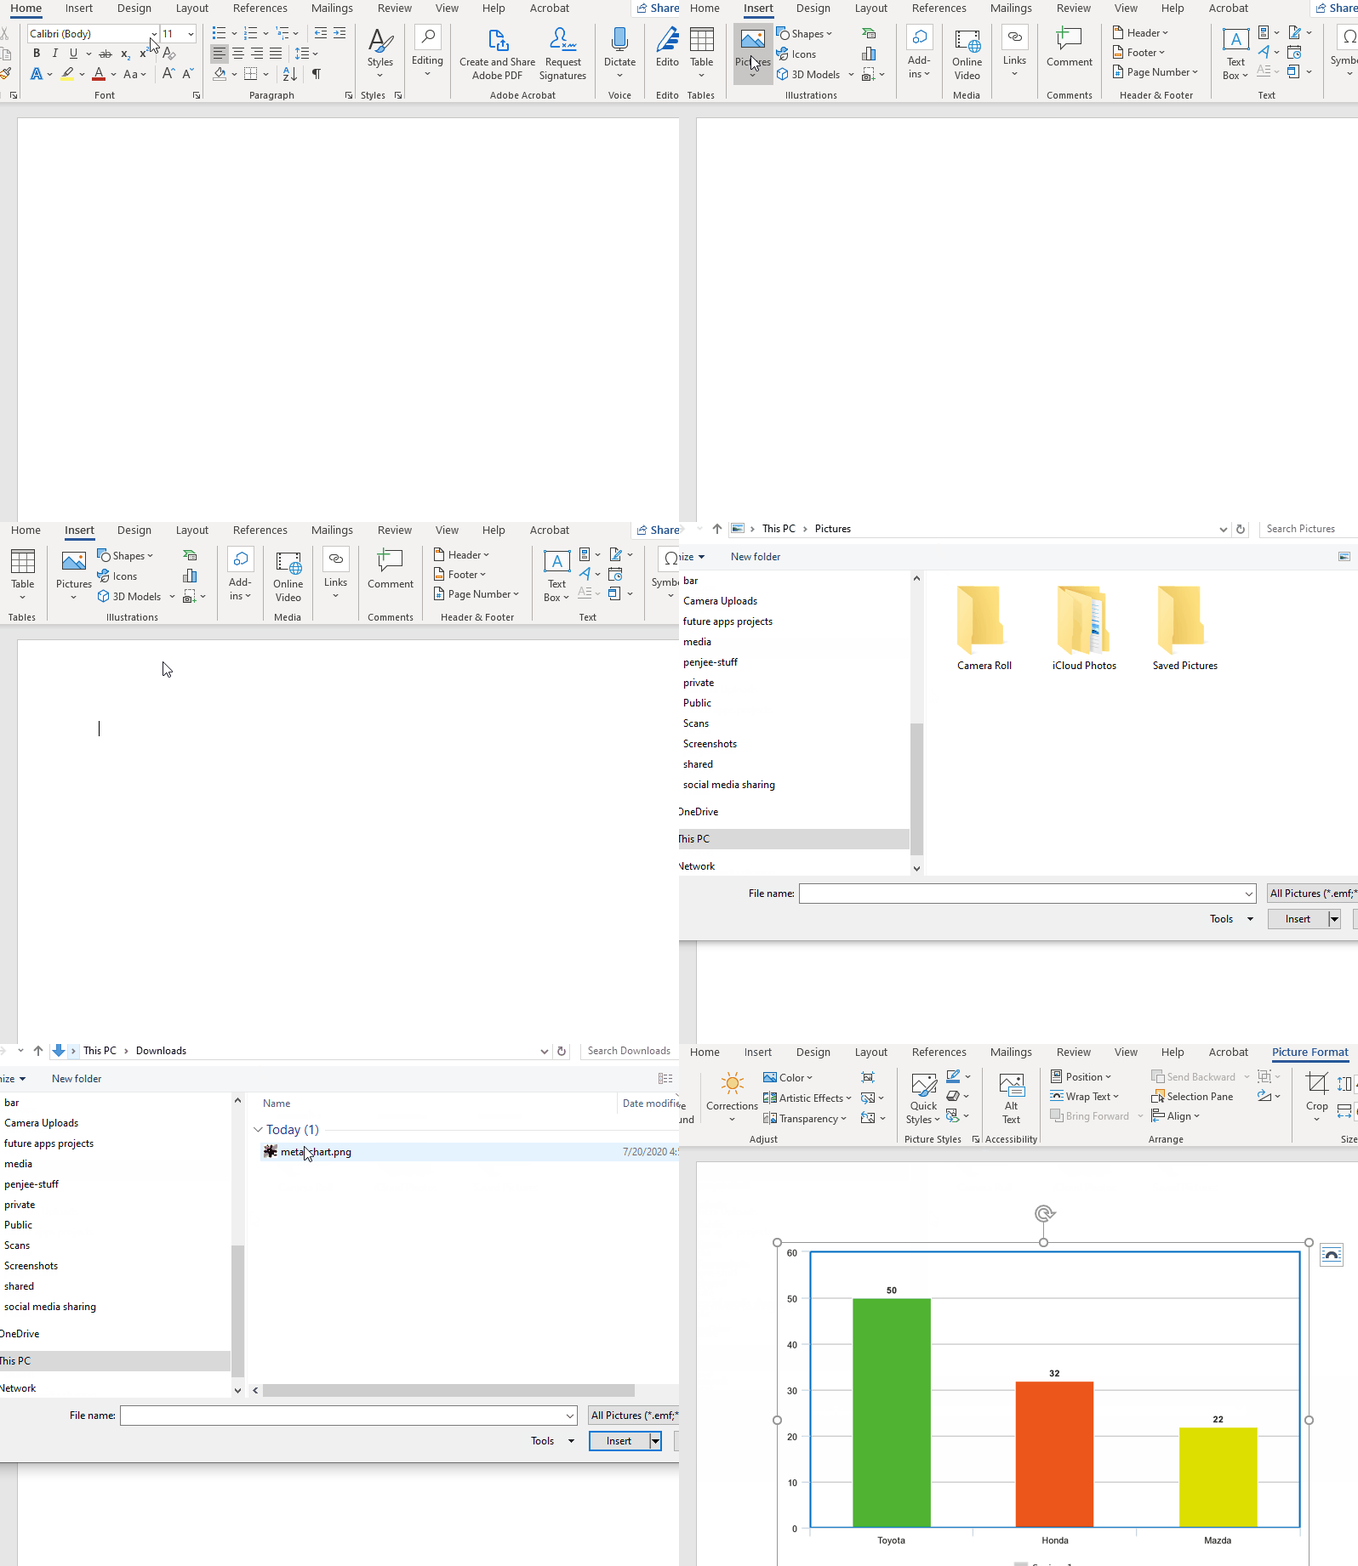
Once you’ve downloaded an image of your chart, there’s no one set of steps for including/embedding the image into a program. However, most applications, whether it’s Microsoft Word or Google Docs have an “insert” option in the top menu . You typically click on the “insert image” option to get the image into the application. Below are 2 animations of how to include images in Google Doc and in Microsoft word. Please keep in mind that Microsoft and Google are always updating their applications so the buttons and steps will inevitably change over time but should be relatively similar to the steps depicted below:

