This is a 2 part tutorial.
I. How to Save A Chart
II. How to Edit Saved Charts
Part I : How to Save a Chart
- You must be logged in to Meta-chart in order to save your chart. So, before you make your chart, log in.
 If you are not logged in, you will see the warning below . This is bad. You need to login in immediately and start making your chart all over again.

- Ok, so you’re logged in. Now , go ahead and make a chart. I made a pie chart comparing meta-chart.com with a site that is fictional (at least at the time of this blog post) called “Lame-chart . com” . Once you get to the display tab , click the save button!

- When you press the save button, you should get a message/prompt telling you that the chart was successfully saved.
Part II : How to Edit a Chart you already saved
- Now, let’s say that a week later, I realized that I made an error on my chart and I want to go back and edit my saved chart. I just log in and go to the dashboard by clicking on my name on the top menu.

- Clicking on your name, will take you to your dashboard. The dashboard is just a place to save and organize your charts, nothing more. We organize your saved charts into folders, and when you save a chart, we put it in the “Uncategorized” folder :

- Click on “uncategorized” as shown above and on the right side you should see the charts that you have saved :

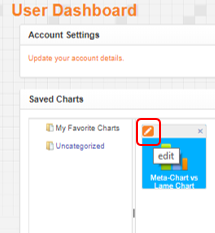
- Click on the “edit” button as shown below


Doing so will load your old chart’s data back into the chart editor where you can change anything that you like and re-save or share it.